Description
For the assessment of air quality it is essential to know the spatial and temporal distribution of air pollutants and meteorological parameters. Wind direction, wind velocity, stability of the atmosphere, convection and the existence and height of inversion layers are parameters relevant to the concentrations of air pollutants within the mixing layer. Our tethered balloon measurement systems are appropriate instruments to investigate the temporal course and the vertical structure of air pollutants within the planetary boundary layer (PBL).
The tethered balloon measurement system is used e.g. for the following investigations of atmospheric processes:
- regional wind regimes, e.g. land-sea breeze
- local flow systems, e.g. mountain valley wind systems, slope winds, cold air flows
- local atmospheric phenomena, e.g. effects of inversion layers on the air quality
- chemical reactions in the troposphere, e.g. ozone formation in city plumes
- investigation of single point sources, e.g. plumes of industrial stacks
- investigation of diffusive sources, e.g. plumes of industrial areas, plumes of cities
- balancing of air pollutants over whole towns, industrial areas, highways etc. using several tethered balloon systems in combination with ground level and other airborne measurements
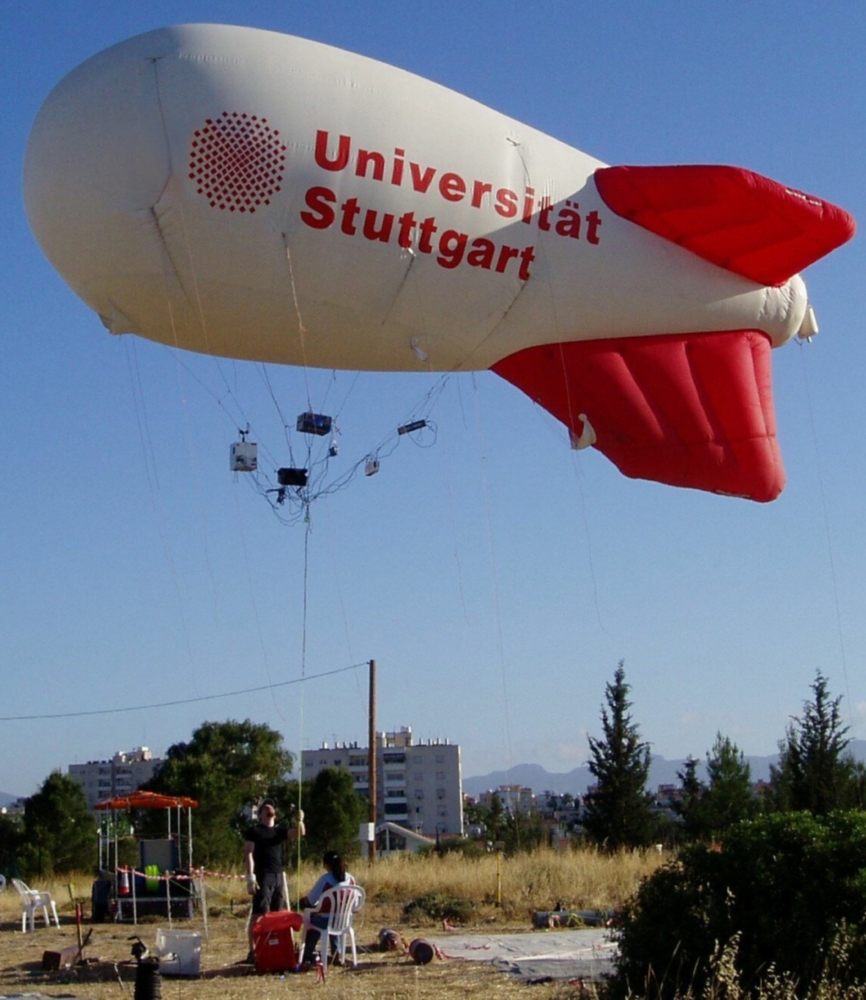
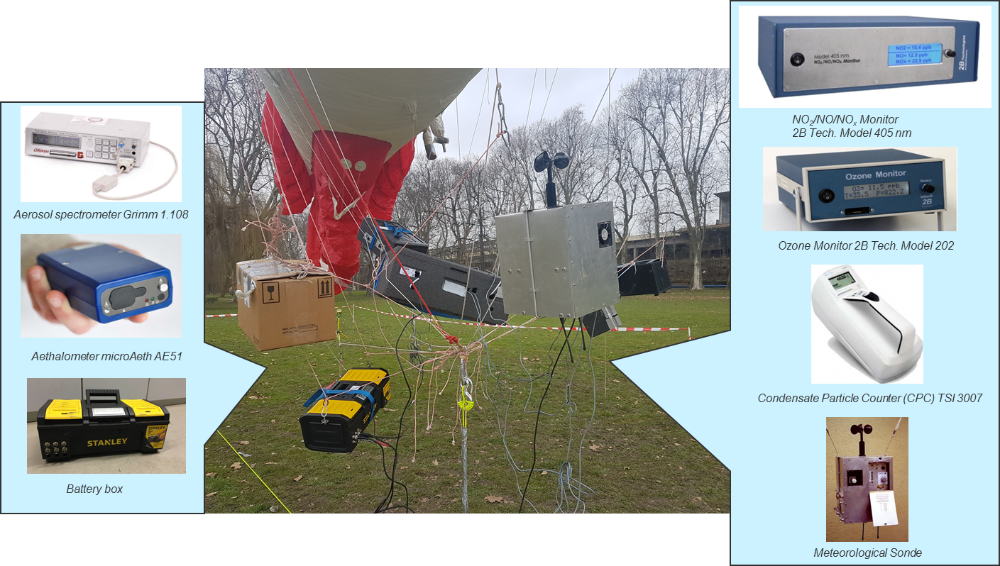
The measurement systems
The tethered balloon measurement systems consist of the balloon itself, a rope, an electrical winch, the analysers and a ground station. The analysers are fixed in the ridging of the balloon. The measurements are continuously and the signals are transmitted via telemetry every 10 seconds to the ground station. The ascent velocity of the balloon depends on measurement strategy and on the reaction time of the analysers and can be varied between very slow and up to 60 m/minute. One sounding (with ascent and descent) takes between 30 minutes and 1 1/2 hours, depending on the ascent velocity and the maximum sounding height. Series of soundings during day and nighttime are possible, e.g. every hour, if necessary for several days in succession.
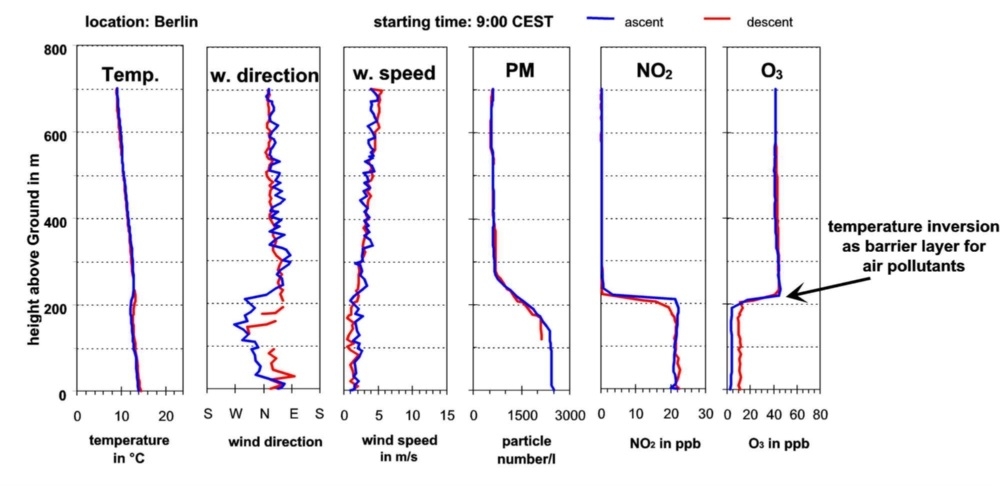
Results
The results of vertical soundings are vertical profiles of the measured parameters. An example is depicted in the figure below. During this morning sounding (9:00 CEST) an elevated inversion layer in 200m above ground is the reason for the accumulation of the air pollutants (NO 2 and particulate matter) near ground level and the depletion of ozone.
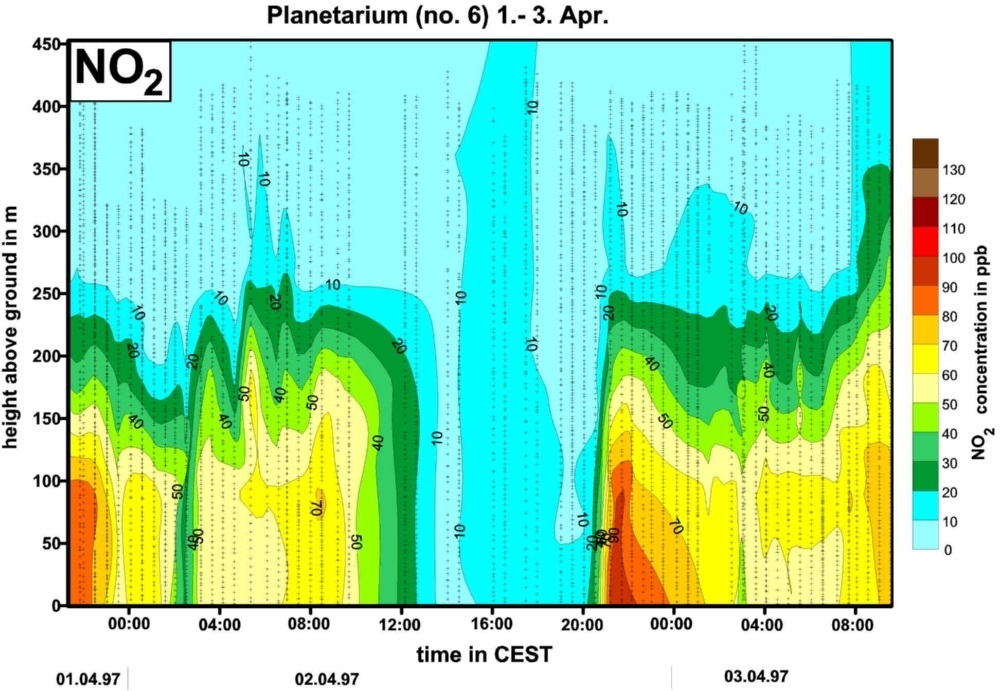
The subsequent results of vertical soundings in succession can be combined to isopleth diagrams like shown in the last figure of this page. Isopleth diagrams show by means of lines of constant values the temporal variation of the vertical distribution above the measurement site during the whole measurement period. The example gives an overview about the temporal variation of the NO2 concentrations distribution at a measurement site in Stuttgart from April 1 st to April 3 rd. The accumulation of NO2 below the nocturnal inversion layer starting from 20:00 CEST can be seen clearly. The vertical extension of this layer and thus high values of NO 2 reach from ground level up to 250 m (see the last figure of this page). After 12:00 CEST the inversion layer is disolved, good vertical distribution and dilution of the air pollutants with low NO 2 concentrations are observed from about 13:00 CEST to 20:00 CEST.
Contact

Ulrich Vogt
Dr.-Ing.Head of Department Flue Gas Cleaning and Air Quality Control (RuL)